Sediment microbiota plays a significant ecological and biogeochemical role in marine ecosystems due to their high abundance relative to the overlying water column. The microbial community is very dynamic and sensitive and can rapidly change due to environmental changes. Therefore, characterization of the sediment microbiota may be used as an important tool for assessing environmental health and indicate changes within the ecological system.
Sediment microbiota plays a significant ecological and biogeochemical role in marine ecosystems due to their high abundance relative to the overlying water column. The microbial community is very dynamic and sensitive and can rapidly change due to environmental changes. Therefore, characterization of the sediment microbiota may be used as an important tool for assessing environmental health and indicate changes within the ecological system.
Considering their importance for ecosystem function and their functionality as an environmental indicator, our knowledge of the sediment microbial communities is very limited, especially along the Israeli continental shelf. Thus, from July 2017, we began to include sediment microbiota as a part of our LTER (Long-Term Ecological Research) monitoring program.
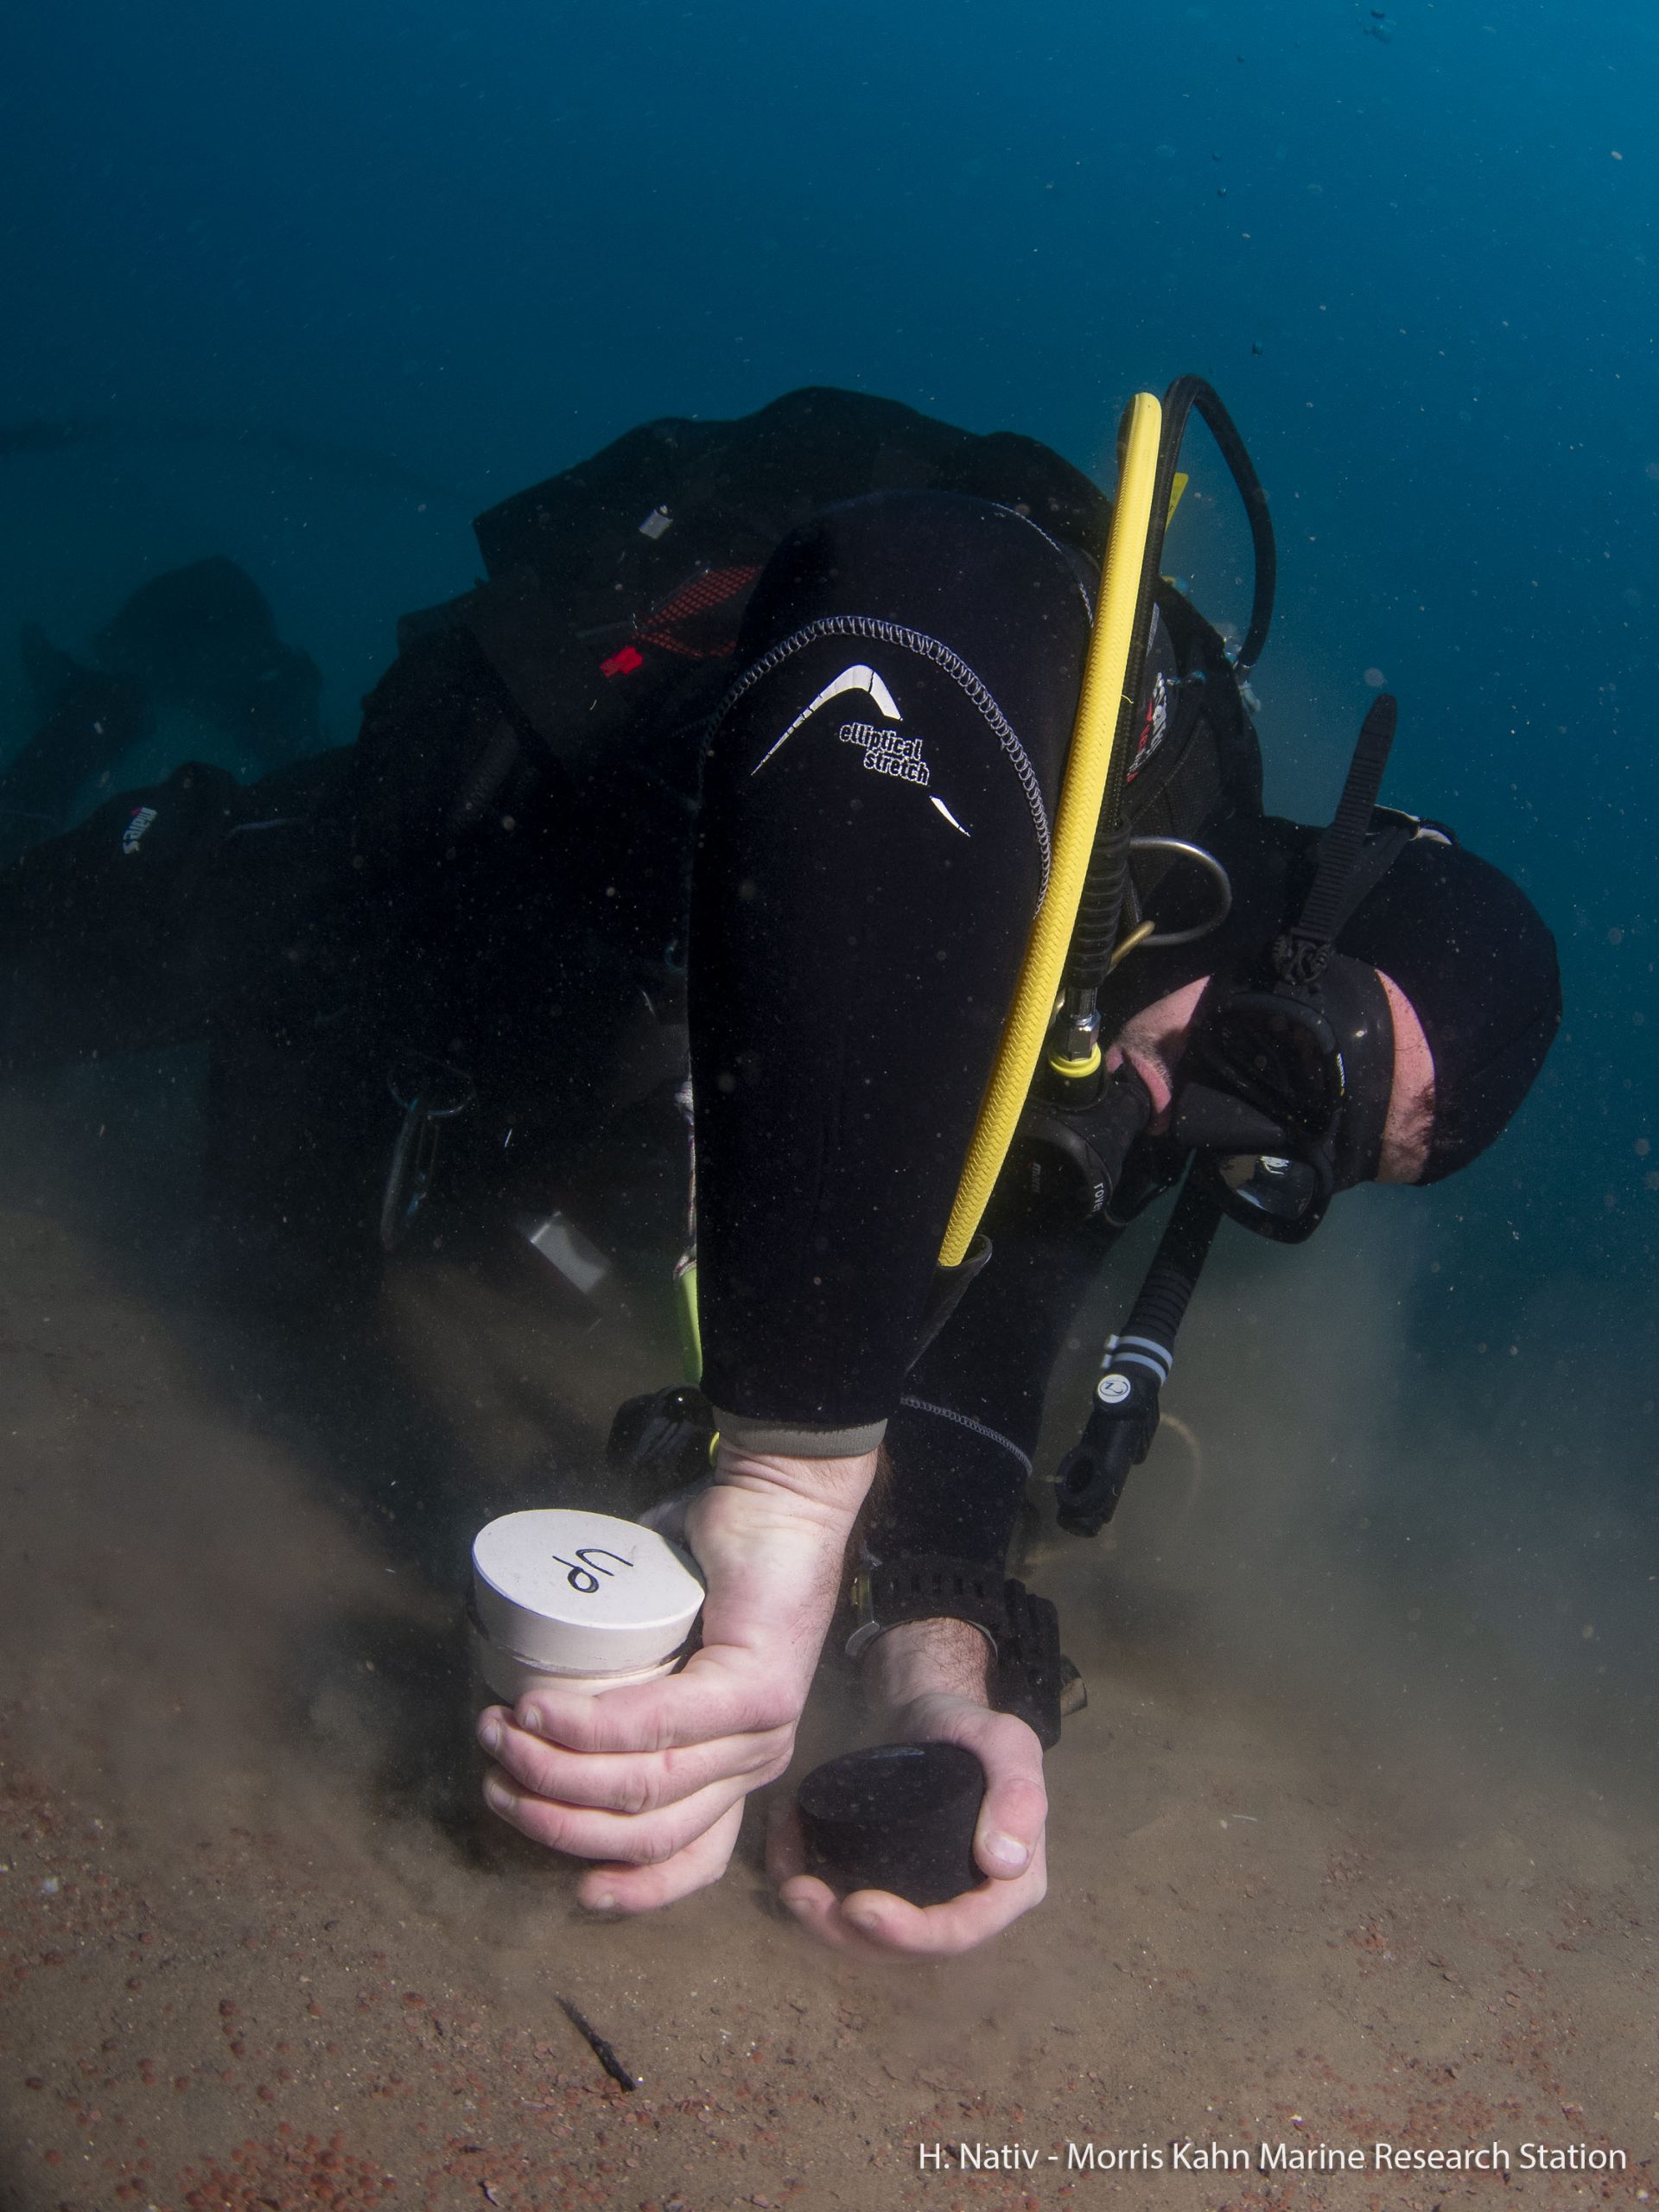
The monitoring is carried out twice a year at four depths (10, 25, 45 and 100 m) along a transect. Two cores from each depth are taken (by diving or by box corer) and each core is split into 1 cm slices (up to 10 cm). The first sampling point is near Maagan Michael (see map on the website) and the deepest sampling point (100m) is located about 1 km from the Leviathan natural gas platform.
We started monitoring before the gas platform was established and we will continue to sample this site over the years to see if there are any changes.
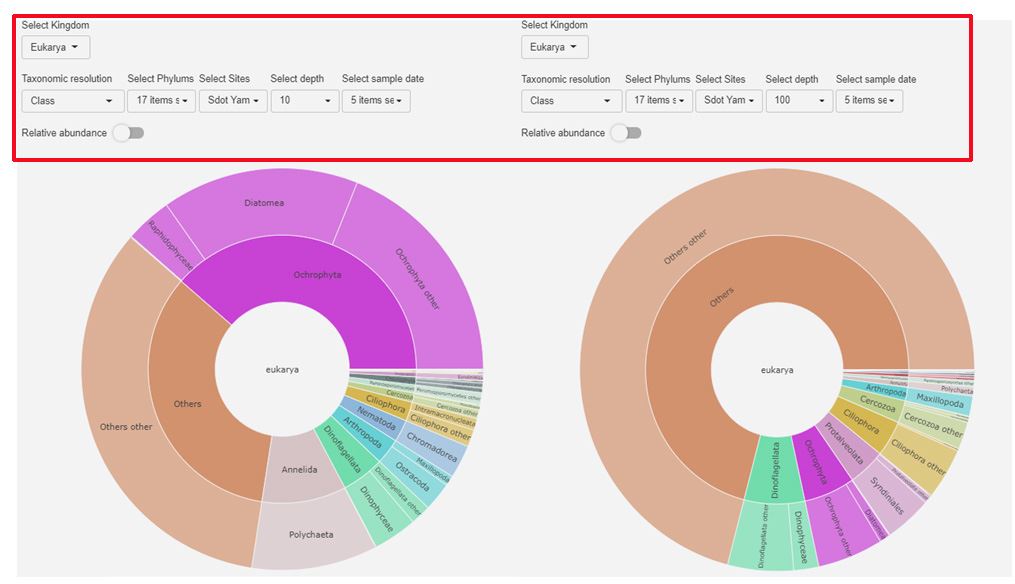
The results in our online database initially characterize the sediment microbial communities (bacteria, eukaryote and archaea). The community data presented in the OTUs tables include effort data such as: date sampled, site, bottom depth, core depth, etc. In addition, a graphic display of the microbiotic distribution and relative abundance (of phylum and class) can be displayed by filtering the parameters by kingdom, site, date, depth, etc.
For example, the charts below (taken from the website) present the main phylum and class of eukaryote communities of 10 and 100 m. From this, we can compare and track the changes (e.g. Dinoflagellata and Ciliophora increased at the 100 m depth, while Annelida group decreased etc.).
The significance of the differences and changes in sediment microbiota will continue to be studied in order to understand the environmental processes and to have a better understanding of the sediment microbial communities and site health.
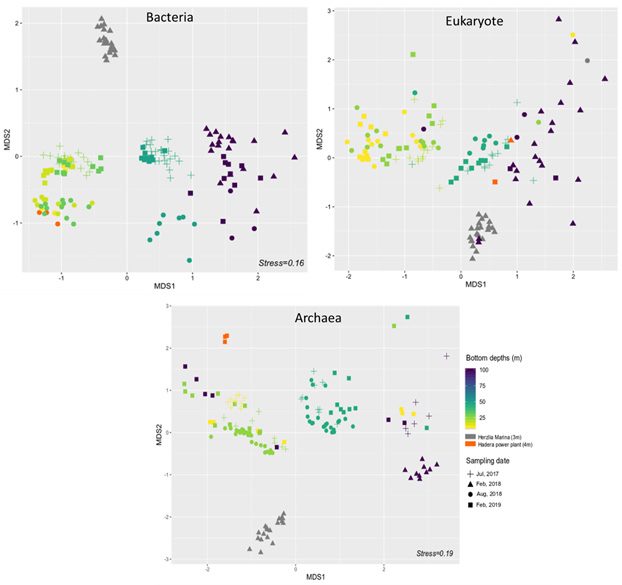
Below is a summary of the four sampling seasons across both years of sampling (winter and summer). The plots exhibit a trend of distribution, with clustering according to depth, from 10-100 m (left to right). The microbiota of the shallow depth (10 and 25 m) were significantly different from the communities of 45 and 100m (Fig. 1).
Figure 1. Summary of the 4 seasons of sampling of sediment microbial communities: Bacteria, Eukaryote and Archaea. Distribution according to bottom depth gradient (10-100 m). Microbial profiles were compared by non-metric multidimensional scaling analysis (NMDS) using the Bray-Curtis distance metric.