Water chemistry
Water chemistry data
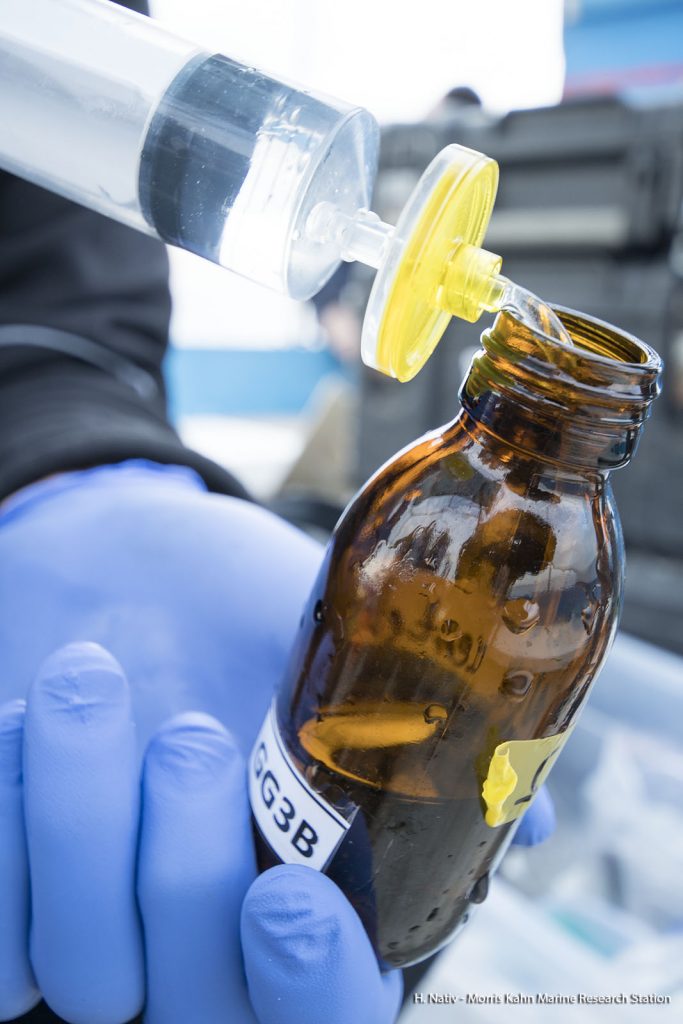
The aim of our team in the water chemistry lab in MKMRS is to take and analyze measurements of the ultra-low levels of dissolved nutrients (nitrate, phosphate, ammonia and silicate) found in the waters off the Israeli coast. We study nutrient cycling in both the shallow and deeper waters. Analysis of flow cytometry (FCM) of cells is carried out by Dikla Aharonovich at the Daniel Sher lab, in Haifa.
Please view full data description PDF
Water chemistry dataset
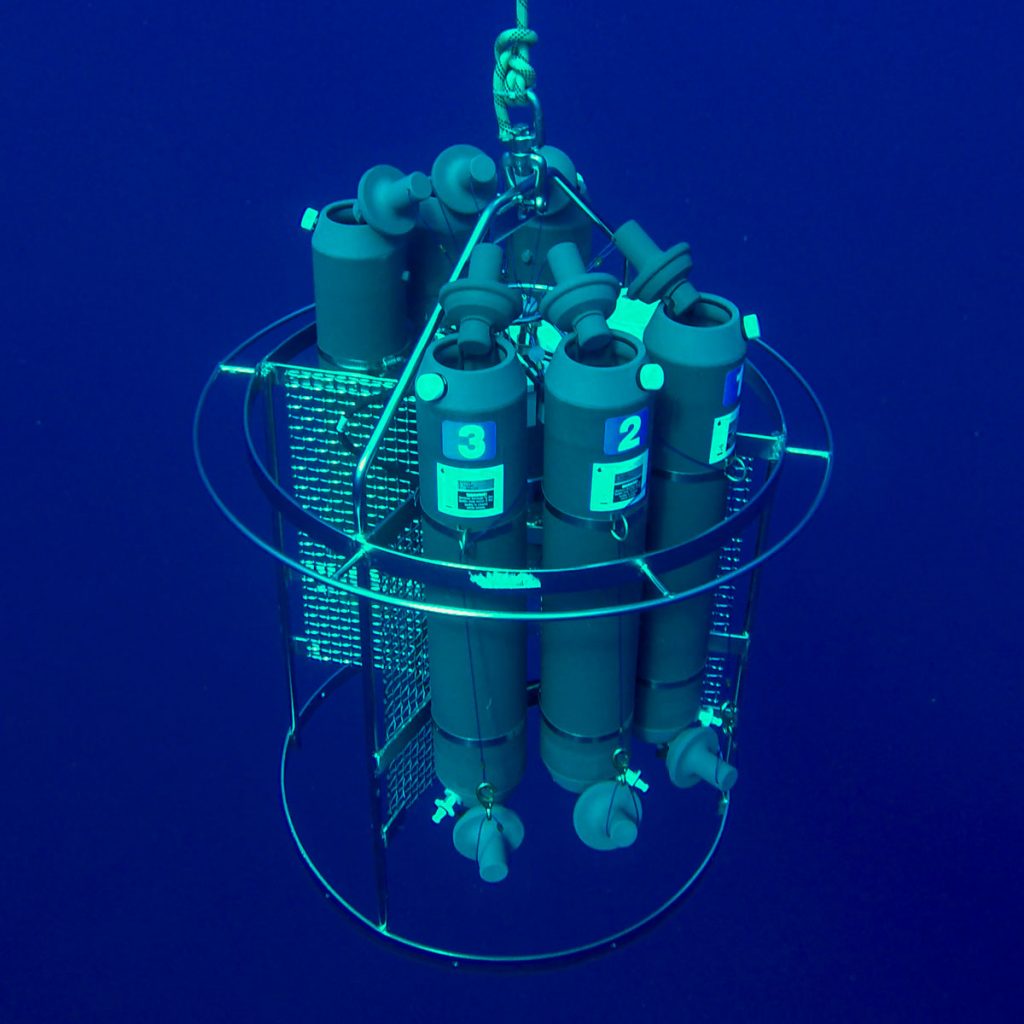
This dataset contains primarily oceanographic data and nutrient concentrations during our seasonal coastal transect cruises and offshore projects. Profiles from 10 m to 100 m depth contours across from Maagan Michael (TSY) using a rosette and CTD (conductivity-temperature-
Nutrient analysis is carried out on a SEAL Analytical 3 Autoanalyzer (AA3) using specific colorimetric methods which were developed to determine nitrate+nitrite, silicate, phosphorus, plus a fluorometric method for ammonium using a Jasco FP 2020 plus Fluorometer. Our ability to detect phosphorus (its limit of detection) was pushed lower using a World Precision Instrument (WPI) detection cell of 1 m long (LWCC-210).
FCM cell counts at rocky habitats
This holds cell count data of High DNA, Low DNA, total cells/ml above the rocky reef during fish/ invertebrate surveys, all collected from the surface waters instantaneously.
Flow cytometry analysis (BD FACSCanto ™ II Flow Cytometry Analyzer Systems, and 2µm fluorescent markers by Polysciences, Warminster PA, USA). SYBR Green I (Molecular Probes/ ThermoFisher) is used for staining. The analysis and results are carried out using FlowJo software. Flow rates are iteratively set throughout each run, and the average rate is used for determining the cell count per ml.
The phytoplankton is classified to genera level (Prochlorococcus, Synechococcus, Picoeuks) according to size and autofluorescence of their natural pigments. Marine cells are typically composed of two populations: High DNA and Low DNA.
FCM populations at rocky habitats
holds the division of the cells data on FCM cell counts at rocky habitats to different cell populations according to the following groups: (a) Large picoplankton; (b) Intermediate picoplankton; (c) Small picoplankton; (d) Intermediate picoplankton low chl; (e) High FSC low chl.
Reference:
If you find the data useful and use it for presentation or else, please credit us with a link to our site as follows:
Data from the Morris Kahn marine Research Station: https://med-lter.haifa.ac.il/
Contact us
For more information and assistance on this data, please contact:
Anat Tsemel (re. Water chemistry, CTD station Nitzan)
Dr. Dikla Aharonovich (re. FCM cell counts at rocky habitats, FCM populations at rocky habitats)